Originally Posted by SG1
 I took some time to look through your sources. Most of what you're saying isn't even addressed by the source material you've provided (Blue), thus total bullshit conjecture on your part. The numbers specifically point to don't seem to add up for me either (Red). Your posts are so full of garbage that I can't realistically take the time to investigate each of your baseless projections (don't feed the trolls).
Let's start with what little you have provided.
The poll size of the first chart is between 1,200 and 2,400 people. While I understand how sample sets work, I'm skeptical of any data that claims to paint an accurate picture of a population by polling .0014 of the population.
The next two charts don't supply a sample size at all.
Here you are saying that immigrants vote 8-2 Democrat.
I read the study and did not see that figure anywhere. The closest I could find was this chart which shows a high of 7-3 for PARTY IDENTIFICATION, not actual voting of non-citizen immigrants (who mostly are not voting)
[img]http://cis.org/sites/cis.org/files/gimpel-realignmnent-t1.jpg/img]
This chart is accompanied by this preceding text:
But recent studies have indicated that the foreign-born, and particularly the large Latino immigrant populations, do not mimic the attitudinal and behavioral tendencies of natives. They have slightly lower participation rates, and they are more Democratic in their party identification and vote preference. Throughout the last decade, for instance, surveys large enough to represent the foreign-born population eligible to vote all showed an undeniably lopsided preference for the Democratic Party. The 2012 Cooperative Congressional Election Study, conducted by YouGov, gauged the partisan preferences of over 2,900 naturalized immigrants, finding 62.5 percent to be Democratic identifiers, 24.6 percent Republican, and 12.9 percent independent (see Table 1).6 Not surprisingly, Mitt Romney's percentage of the Latino vote, just 27 percent, was the lowest share for a Republican presidential candidate since 1996, the year Bob Dole lost badly to Bill Clinton (Lopez and Taylor 2012). In 2008, YouGov polled about 1,600 naturalized citizens and party loyalty also exhibited a lopsided bias: 55 percent Democratic, 31 percent Republican, and 14 percent independent. John McCain won an estimated 31 percent of the Latino vote that year — better than Romney, but not by much. Arguably, Republicans might do better if they nominated more Latino candidates, although that is not entirely clear given that ethnic solidarity is not strong enough to suppress partisan loyalty on anything like a consistent basis.
I've bolded a line in the text that says a survey large enough to represent the foreign-born population. They are talking about 2,829 (not quite the "over 2,900" they state) out of millions of citizens. I have a difficult time broad brush painting a group of people based on a fraction of the members. One thing not addressed, is that according to the poll in this study, the tendency of legal immigrants (ALL legal immigrants, not just Latinos) to affiliate with Democrats rose 7.5 percent between 2008 and 2012. However, the Latino population as a whole (according to this poll) only rose 6.3 percent during that time. That the non-citizen immigrant tendency to affiliate with the Democrats went down 10.2 percent in that same time period seems to have been wholly ignored.
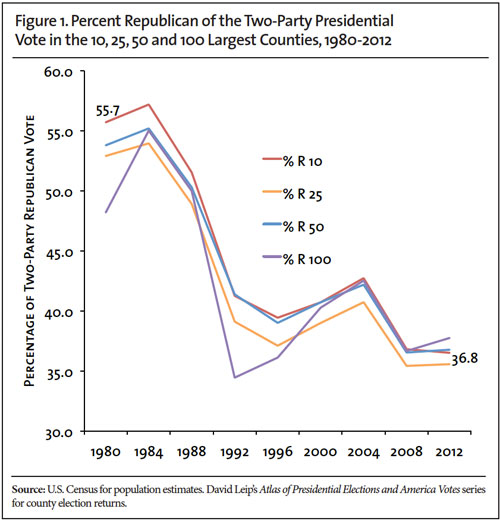
The main point of this study, for those who aren't interested in reading the entire thing, is that for every 1% increase in immigrant population, Republican votes drops by .59%. They use this graph of voting percentage from 1980 to 2012 to make this point.
The conclusion of all this data is as follows:
I've bolded two sentences that I take issue with here. First, "The conclusion is inescapable" sounds a lot like "The science is settled" to me. Second, my initial reaction is that it is a bit of a stretch to take that graph of the highest population counties growing more and more democratic over time and ultimately conclude that it is solely the result of an increasing immigrant population. The study says "even after controlling for alternative explanations of GOP performance," which they explain means placing in controls for household median income and population of African Americans. Are we expected to fully buy into the idea that the only thing that has changed over the last 30 years is that there are more immigrants?Using standard statistical methods, this research has estimated the impact of the rising percentage of immigrants across U.S. counties on Republican presidential voting in the presidential elections from 1980 to 2012. The conclusion is inescapable. As the immigrant population has grown, Republican electoral prospects have dimmed, even after controlling for alternative explanations of GOP performance. A typical drop in Republican support in a large metro area county is about six percentage points. In practical terms, an urban county that cast 49 percent of its vote for the Republican candidate in 1980 could be expected to drop to 43 percent by 2012, just as a consequence of a rising immigrant population.Across all U.S. counties, including the many smaller counties, the estimated effect of immigration is to drop Republican vote share about two percentage points. Even in seemingly remote locations with negligible immigrant populations, the effect is sufficient to move a 51 percent county to a 49 percent county. Aggregated over the large number of counties and viewed through the template of the Electoral College's winner-take-all system of elections, the impact of immigration is easily sufficient, by itself, to decide upcoming presidential elections.
My conclusion? I don't see anything saying that immigrants that become citizens vote Democrat 8-2.
Next let's talk about your claim that 13% of illegal immigrants vote.
You said:
and(Targeted in swing states as to win over voters and get rid of illegals who voted (13% to those arrested admit they do))
Here are the first two paragraphs of the source you cited:13% of Illegals Admitting they voted (its so much more, but this is from self admission without fear of prison)
http://archive.is/iGZws
Right off the bat we can tell that this is biased garbage spouting off claims with zero supporting evidence. This article continues on and at some points states:As we always knew, California and American elections are filled with fraud and corruption. Thanks to a new poll, we now know that approximately 13% of illegal aliens vote. Since they are already criminals, stealing ID’s or using phony ID’s. lie to get welfare, steal jobs—why not vote as they to lose. Since they can not be deported or jailed, they have nothing to lose. Obama is protecting these law breakers.
Could this be why real citizens don’t vote—the illegal aliens outvote them? Worse, in close elections illegal aliens can make the difference. Corruption? Look at the ballot box. In fact, they could have elected a President and Senator!
A poll by John McLaughlin confirms again we may have a significant problem with non-citizens participating illegally in our elections. Based on a sample survey of 800 Hispanics in 2013, McLaughlin found that of foreign-born respondents who were registered voters, 13 percent admitted they were not United States citizens.
It says nothing about anyone who was arrested. What it actually says is that a guy sampled 800 Hispanics. Of those foreign-born that were registered to vote, we have no idea what that number is, 13% said they were not US citizens. Even if we assume that ALL 800 of the "Hispanics" surveyed were registered to vote, 13% of them comes to a grand total of 104 people. Let's not forget that the context of this article is that so many illegals are voting that they are swinging elections, AND that they outvote actual citizens! Compounding this information, provided by you, and your suggestion that it's a well know fact that "it's so much more" (completely not supported by you), I can only come to the conclusion that you are a troll of below average intelligence that hates Mexicans.

Colorado AR-15 Shooters Club Discussion Forums
Welcome to the Colorado AR-15 Shooters Club Discussion Forums.